Loudness and envelope descriptors
In this example we compute a few features that can be used to describe the envelope and loudness of an audio signal. Essentia contains algorithms for basic loudness computation as well as the most up-to-date loudness standard in broadcasting, EBU R 128.
filename = '../../../test/audio/recorded/techno_loop.wav'
import IPython
IPython.display.Audio(filename)
import essentia
import essentia.standard as es
# Plots
%matplotlib inline
import matplotlib.pyplot as plt
from pylab import plot, show, figure, imshow
plt.rcParams['figure.figsize'] = (15, 6) # Set plot sizes to something larger than default
Envelope, RMS, high-frequency content
# Let's load only the first 10 second of audio
SEGMENT_LENGTH = 10
audio = es.EasyLoader(filename=filename, startTime=0, endTime=SEGMENT_LENGTH)()
pool = essentia.Pool()
windowing = es.Windowing(type='blackmanharris62', zeroPadding=2048)
spectrum = es.Spectrum()
rms = es.RMS()
hfc = es.HFC()
for frame in es.FrameGenerator(audio, frameSize=2048, hopSize=1024):
frame_spectrum = spectrum(windowing(frame))
pool.add('rms', rms(frame))
pool.add('rms_spectrum', rms(frame_spectrum))
pool.add('hfc', hfc(frame_spectrum))
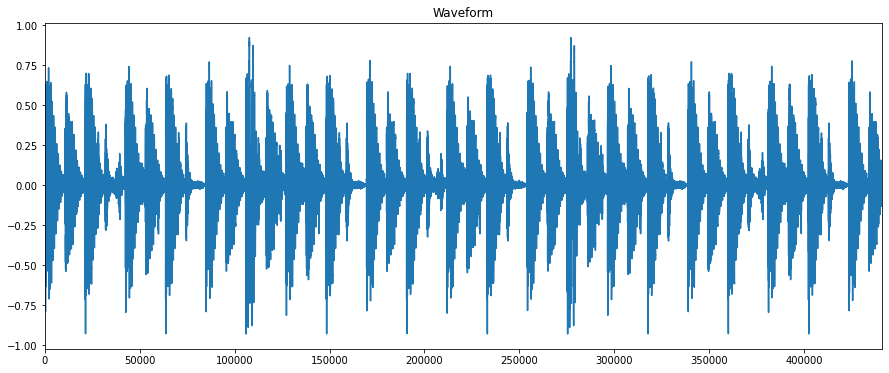
plot(audio)
plt.xlim(0, 44100 * SEGMENT_LENGTH)
plt.title("Waveform")
show()
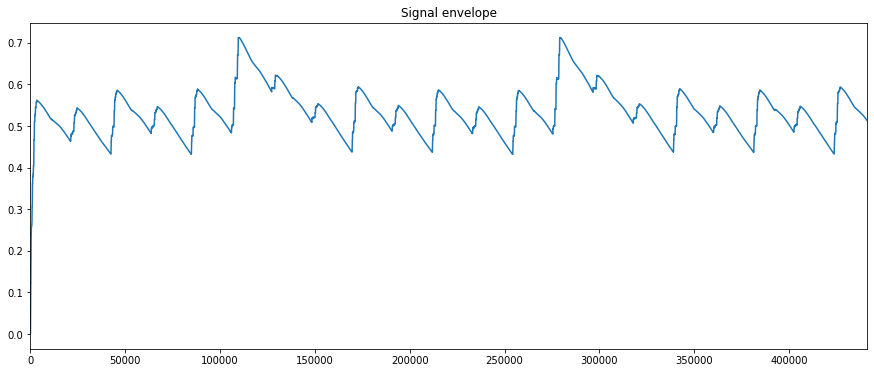
envelope = es.Envelope()
plot(envelope(audio))
plt.xlim(0, 44100 * SEGMENT_LENGTH)
plt.title("Signal envelope")
show()
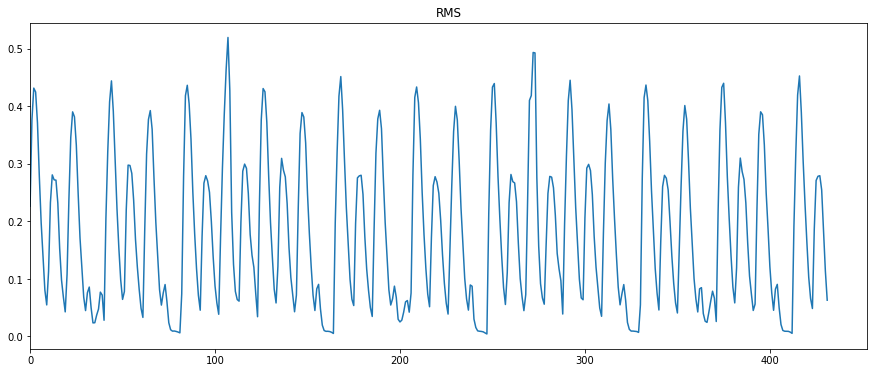
plot(pool['rms'])
plt.title("RMS")
plt.xlim(0)
show()
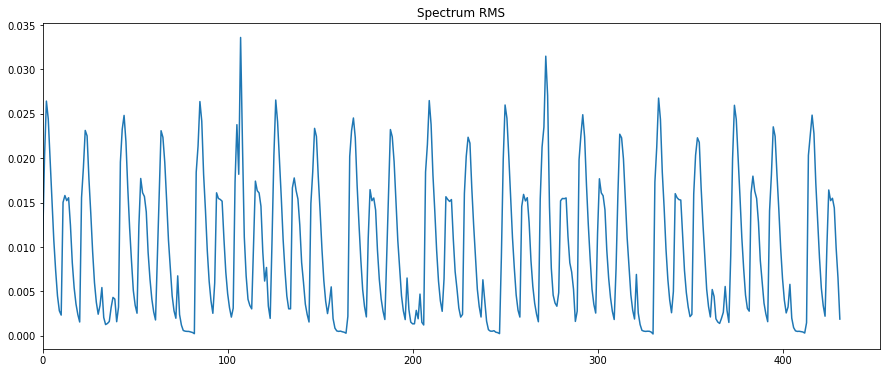
plot(pool['rms_spectrum'])
plt.title("Spectrum RMS")
plt.xlim(0)
show()
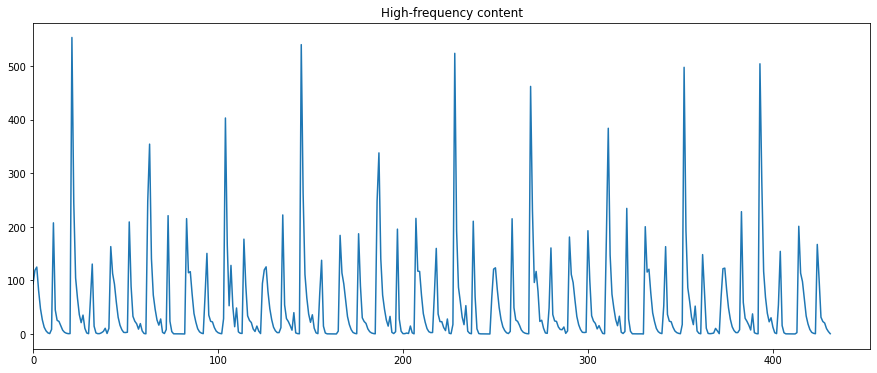
plot(pool['hfc'])
plt.title("High-frequency content")
plt.xlim(0)
show()
EBU R128 loudness
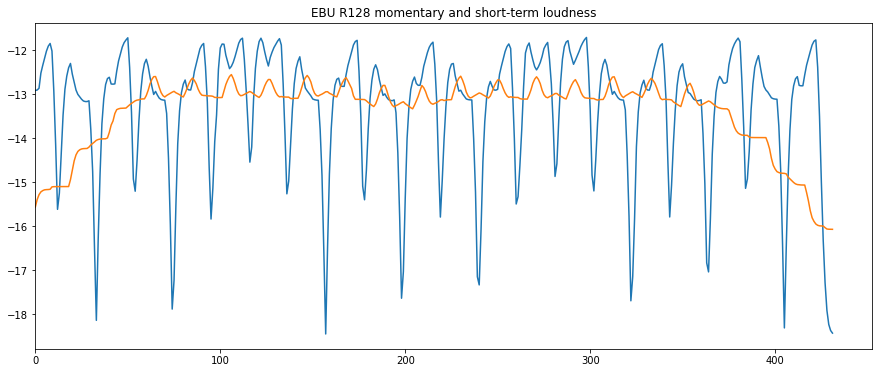
Essentia provides the LoudnessEBUR128 algorithm which implements a common standard in broadcasting. It allows estimating overall loudness and its momentary and short-term fluctuations and dynamic range.
# LoudnessEBUR128 requires stereo in 44100 Hz sample rate
audio_st, _, _, _, _, _ = es.AudioLoader(filename=filename)()
audio_st = es.StereoTrimmer(startTime=0, endTime=SEGMENT_LENGTH)(audio_st)
ebu_momentary, ebu_shortterm, ebu_integrated, dr = es.LoudnessEBUR128(hopSize=1024/44100, startAtZero=True)(audio_st)
plot(ebu_momentary)
plot(ebu_shortterm)
plt.title("EBU R128 momentary and short-term loudness")
plt.xlim(0)
show()
print("Integrated loudness:", ebu_integrated)
print("Dynamic range:", dr)
Integrated loudness: -13.052407264709473
Dynamic range: 2.255620002746582